

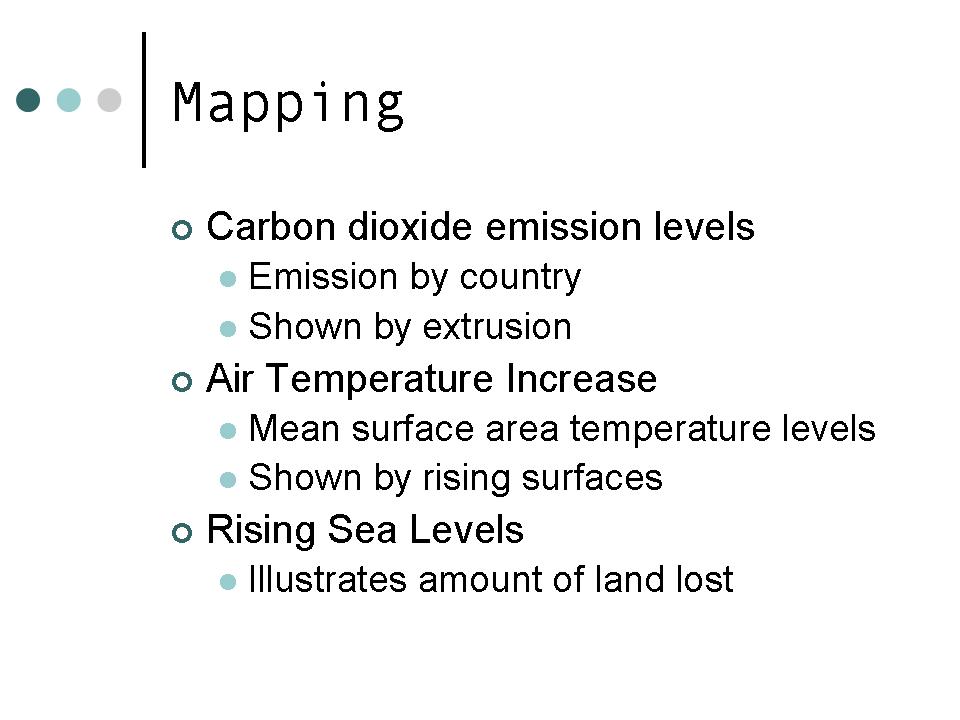

The first animation image shows all three mappings juxtaposed; the second animation image omits the air temperature change.
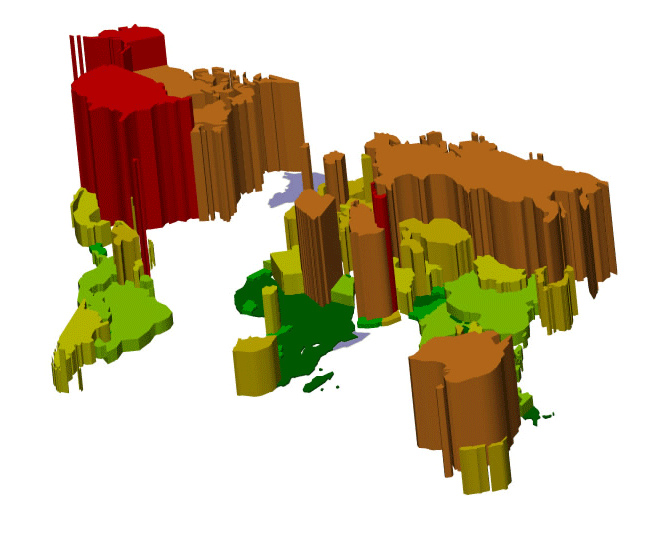
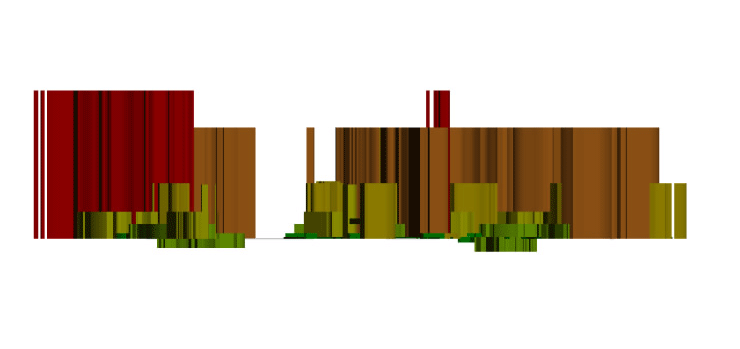

 The mapping that includes the sea level rise is illustrated in the previous post. I am still working out the best way to portray such information.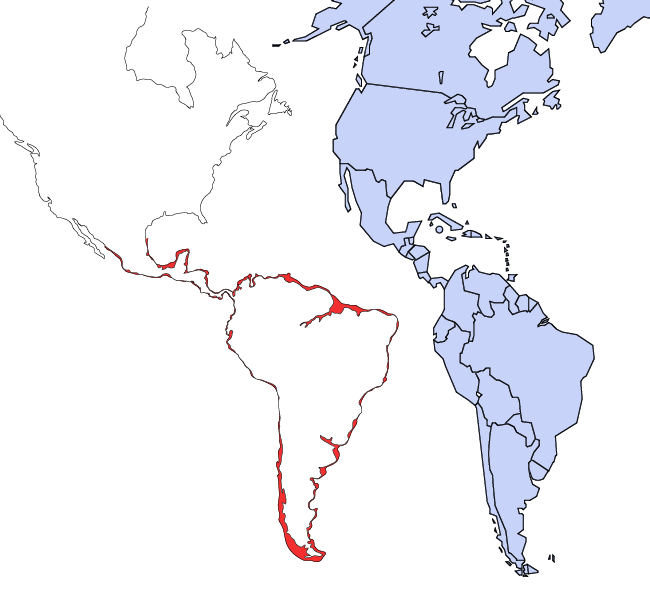
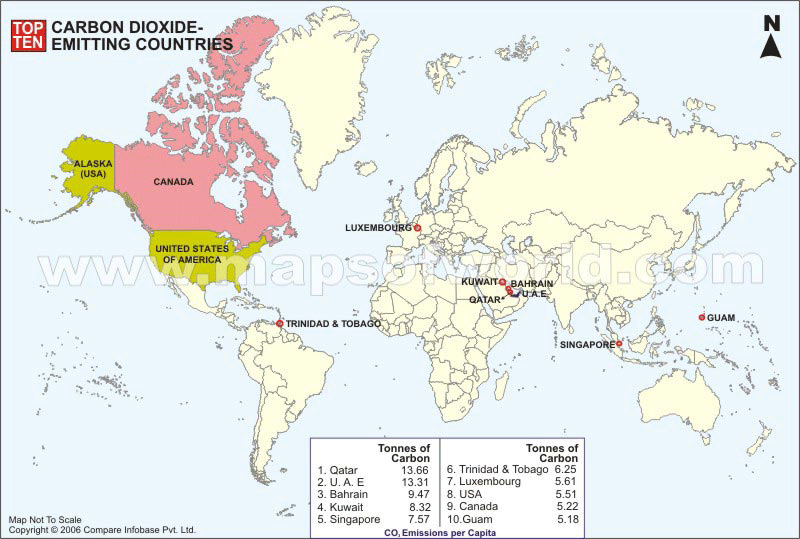
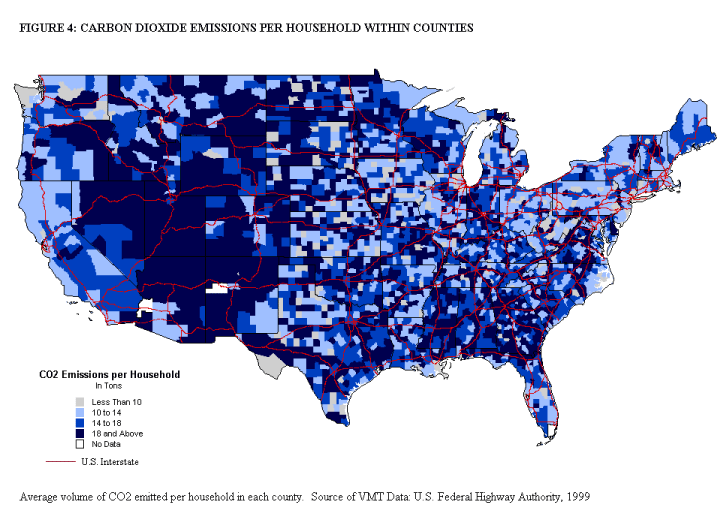
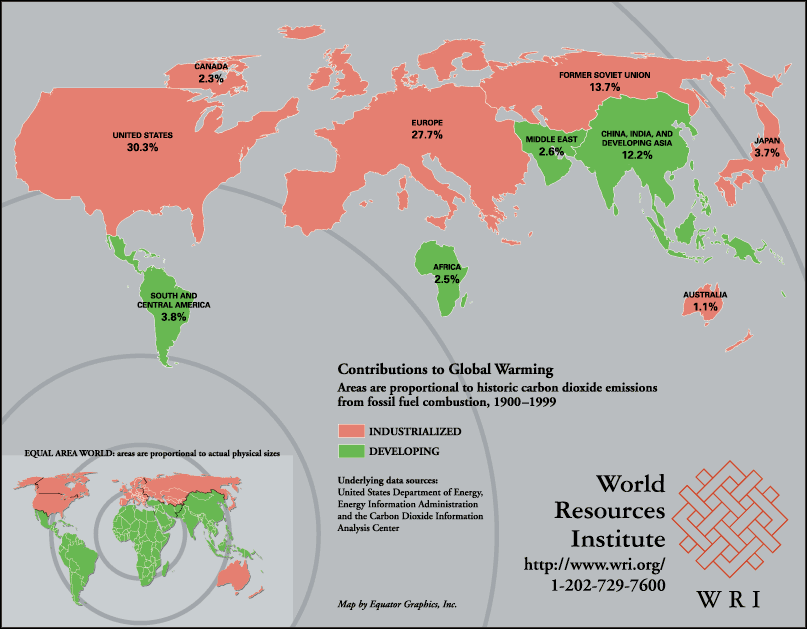 Emission Animation Test on FormZ
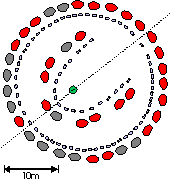
 The most famous neolithic monument, Stonehenge in Wiltshire, England, was constructed from 2750 BC to 1500 BC. Built in several phases, it is a series of concentric rings, utilizing post and lintel. In addition, it consists of a number of uprights, sacred "blue" stones, and a circle of movable "marker stones" set in pits. There is a landscaped trench on the exterior of the rings. Similar to other megalithic structures, the work was executed through highly accurate engineering and by utilizing techniques for mass transportation from far distances.
 There are over 40,000 megalithic structures around Europe. Theories have been developed that link the placement of megalithic forms with the fear of floods from the gods. It has been used to explain their sudden birth, widespread development, and their relationship to the sea. Such a theory is further discussed on this site.