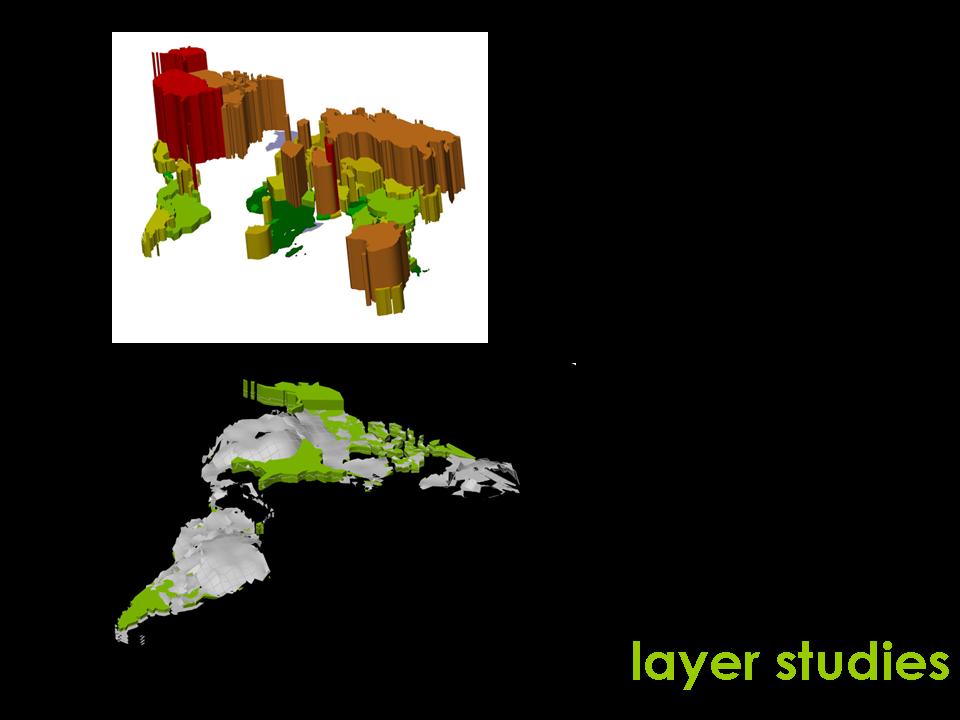
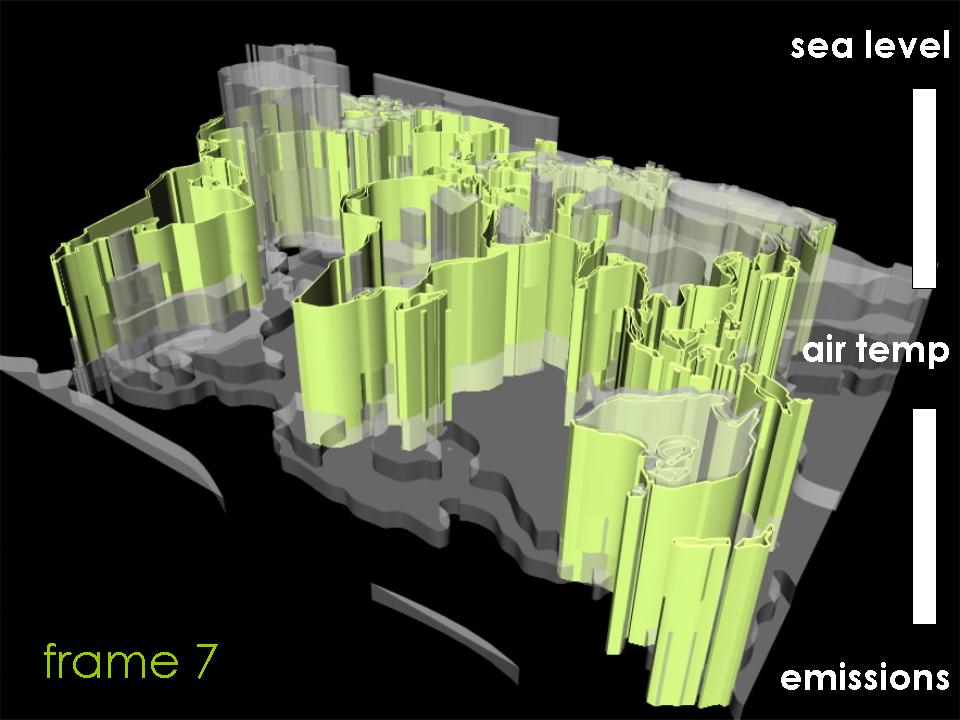
The animation begins with the level of emissions by country. Slowly the data on the change in temperature appears.
 Slowly the data on the change in temperature appears.
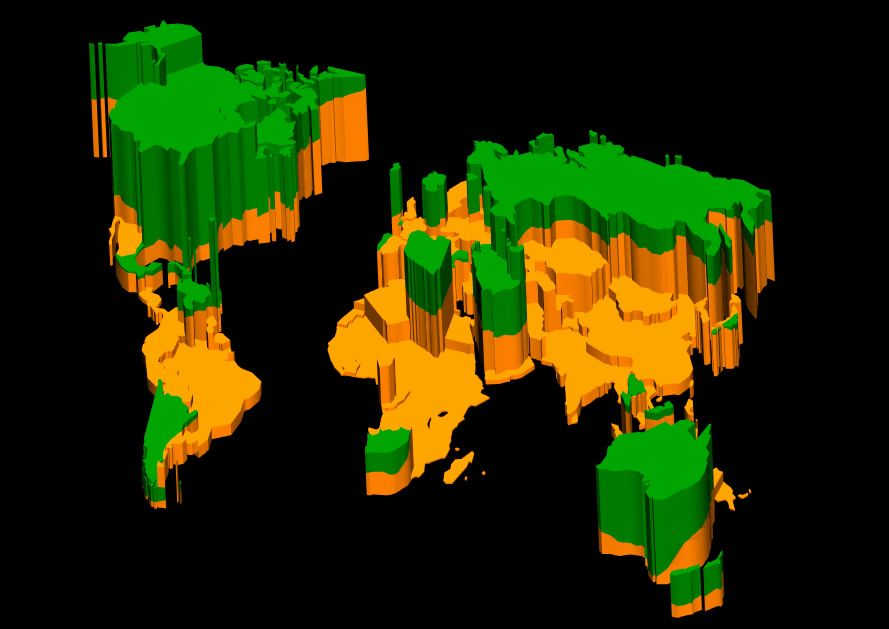 The air temperature data rises to stack on top of the emission data revealing the areas experiencing both conditions.
 The extruded changing sea level plates have been inserted into the datascape.
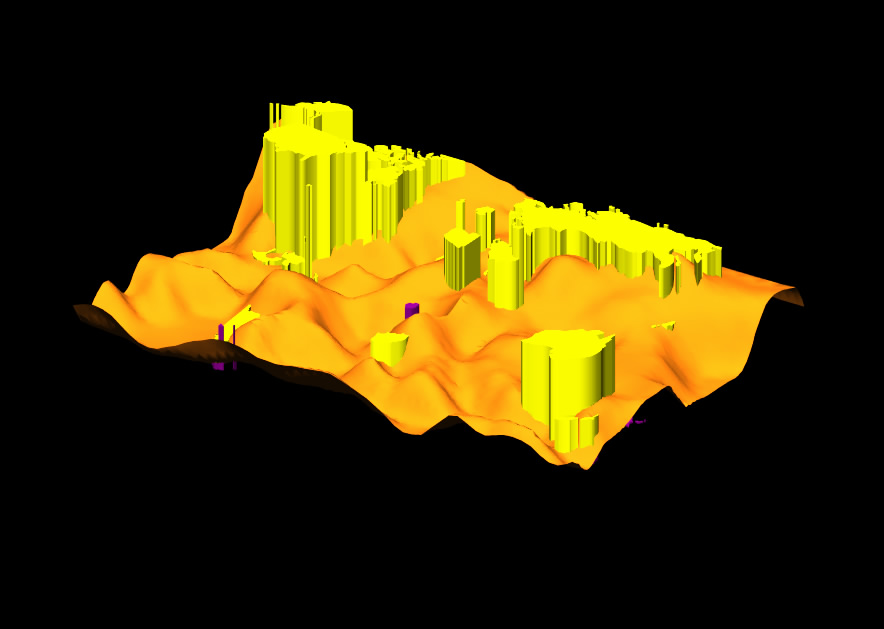
The final two images show the result of taking the difference of the sea level plates and the causes datascape. The areas that are left are in the greatest dangers of being lost due to the causes. These areas are adding to their own destruction and in turn killing themselves.

 Based on the final mappings, these areas significantly contribute to global warming and are experiencing its effects. How would the conditions in these areas contribute to their design? How can these areas be maintained?