First generated image attempting new topographic mesh to then incorporate extruded emission data; little success early on manipulating the mesh

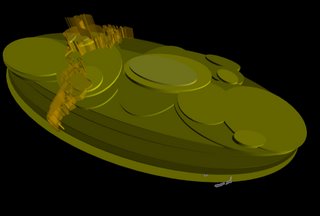
Combination of emission data and air temperature in next four images using extrusion for both sets of data: air temperature data was extruded in circular forms while emission data appears in a translucent orange


New Scheme where air temperature data is used to generate new topographic landscape
Extrusion incorporating new topography

Combination of emission data and air temperature in next four images using extrusion for both sets of data: air temperature data was extruded in circular forms while emission data appears in a translucent orange


New Scheme where air temperature data is used to generate new topographic landscape

Extrusion incorporating new topography

This afternoon I was able to figure out how to manipulate the mesh to incorporate my previous data. I think this would be the most effective way of representing this data. I am looking forwards to the results of the mapping and see tremendous potential for construction of this landscape. By creating a layered type of datascape, I am creating a new terrain that can in turn be printed on the 3D printer and lazercut....let's see where else this map can go....

No comments:
Post a Comment